

In normal circumstances, Profiler uses the known experimental line width of DSS (from the CSI calibration step performed in Processor) to calibrate the compound library on a per spectrum basis, i.e. to determine the expected line width of every single peak of every cluster of every single compound.
However, in the absence of a supported internal standard such as DSS/TSP in the samples, a different strategy must be adopted. The same holds true when DSS/TSP undogoes partial chemical binding to larger unfiltered molecular species in solutions (such as proteins and lipids). Partial binding increases the effective molecular weight of DSS/TSP and therefore also its apparent linewidth. Becasue library calibration depends on the experimental DSS/TSP linewidth, the compound signatures will highly likely appear much wider than the experimental signals.
In these scenarios, library calibration must be performed indirectly using an experimental resonance whose identity is known. In other words, an experimental signal from of a known compound is used to determine what the DSS/TSP line width would have been if it had been present in solution, or if it had not been affected by partial chemical binding.
The chosen resonance for this purpose can be a single peak or a multiplet,but it must be isolated from any other resonances as much as possible. For best results, it also must be sufficiently intense and not contaminated by noise.
Procedure:
Given a series of spectra (in cnx format) showing signs of partial DSS/TSP binding, or recorded in the absence of DSS or any other supported Chenomx internal standards,
-
Position a cluster of reference where it experimentally appears in every single file. The cluster does not need to be fit in terms of height/concentration, only a good starting position matters. You can do this manually, or automatically on an entire set of files using the Compound snapper functionality.
-
Load any processed file in the first step above, select the reference compound and its reference cluster. Only a single cluster must be selected. The chosen cluster should be isolated in the spectra as much as possible, and should not overlap with any other cluster, either with other clusters from the same compound or other compounds. Choose Set CSI line width from the Special menu. Follow the instructions in the provided interface.
-
The software will evaluate the reference cluster in the series of provided spectra by determining its proper location and line width, from which it will back-calculate what line width the DSS/TSP peak would have had if it had been part of the sample.
-
Once the operation is finished, inspect each of the processed cnx file. The referenced cluster that was chosen for the operation should be properly positioned, its height (and concentration) however remains unmodified. If the operation succeeded, the line wdith of the compound entries in Profiler's compound table should match very closely the experimental signals.
IMPORTANT NOTE: In back-calculating the DSS/TSP line width from experimental resonance we make the assumption that the reference peak that is used is not affected by binding, which may not be necessarily true. To avoid partial chemical binding is it highly recommended to filter samples using 3 kDa filters.
An Eretic signal can be used to determine the concentrations within a sample that does not contain an internal standard, such as DSS/TSP.
The use of an Eretic signal in cNx Suite must obey certain conditions:
-
If your experimental conditions (solvent type, pulse sequence, acquisition parameters) differ from the standard ones used by Chenomx to develop its compound library, it is recommended to develop your own database under your own conditions.
-
The electronically-added Eretic signal has to be built by the user and added to the experimental fids directly using the spectrometer venor's' software. The Eretic signal has to be calibrated with a solution containing the known concentration of a compound known to be present in the samples to be analyzed, for instance, 0.45 mM of Alanine.
The final and absolute eretic-corrected concentrations are determined based on the area of the eretic signal.
For instance, if the eretic peak was built in relation to the methyl group of alanine, for a given spectrum, the profiled concentrations must be multipled by a global correction factor f evaluated according to:

To obtain the correction factor for a given file, see the next section
-
The Eretic signal has to be added in a spectral region exempt of any other resonances (10.0 ppm in aqueous sample for instance).
Without the use of an internal standard, the concentrations obtained in Profiler are only relative with one another (in a given sample), not absolute. Post-calibration of profiled concentrations using an eretic signal to obtain absolute concentration is possible, but it requires knowing what the area of the eric peak corresponds to, in terms of a specific peak or multiplet of a profiled compound, for instance 0.45 mM of the methyl doublet of alanine.
Procedure:
To post-calibrate profiled concentrations based on a eretic signal,
-
Export the concentrations of a group of cnx file using Tools menu > Batch operations > Batch Export.
-
In one of the spectra select the cluster of reference the eretic signal is related to, for instance, the methyl group of alanine around 1.47 ppm. Then choose Special menu > Eretic quantification
-
In the provided interface, choose select a series of spectra and a location and name and location for the generated output file (tsv format).
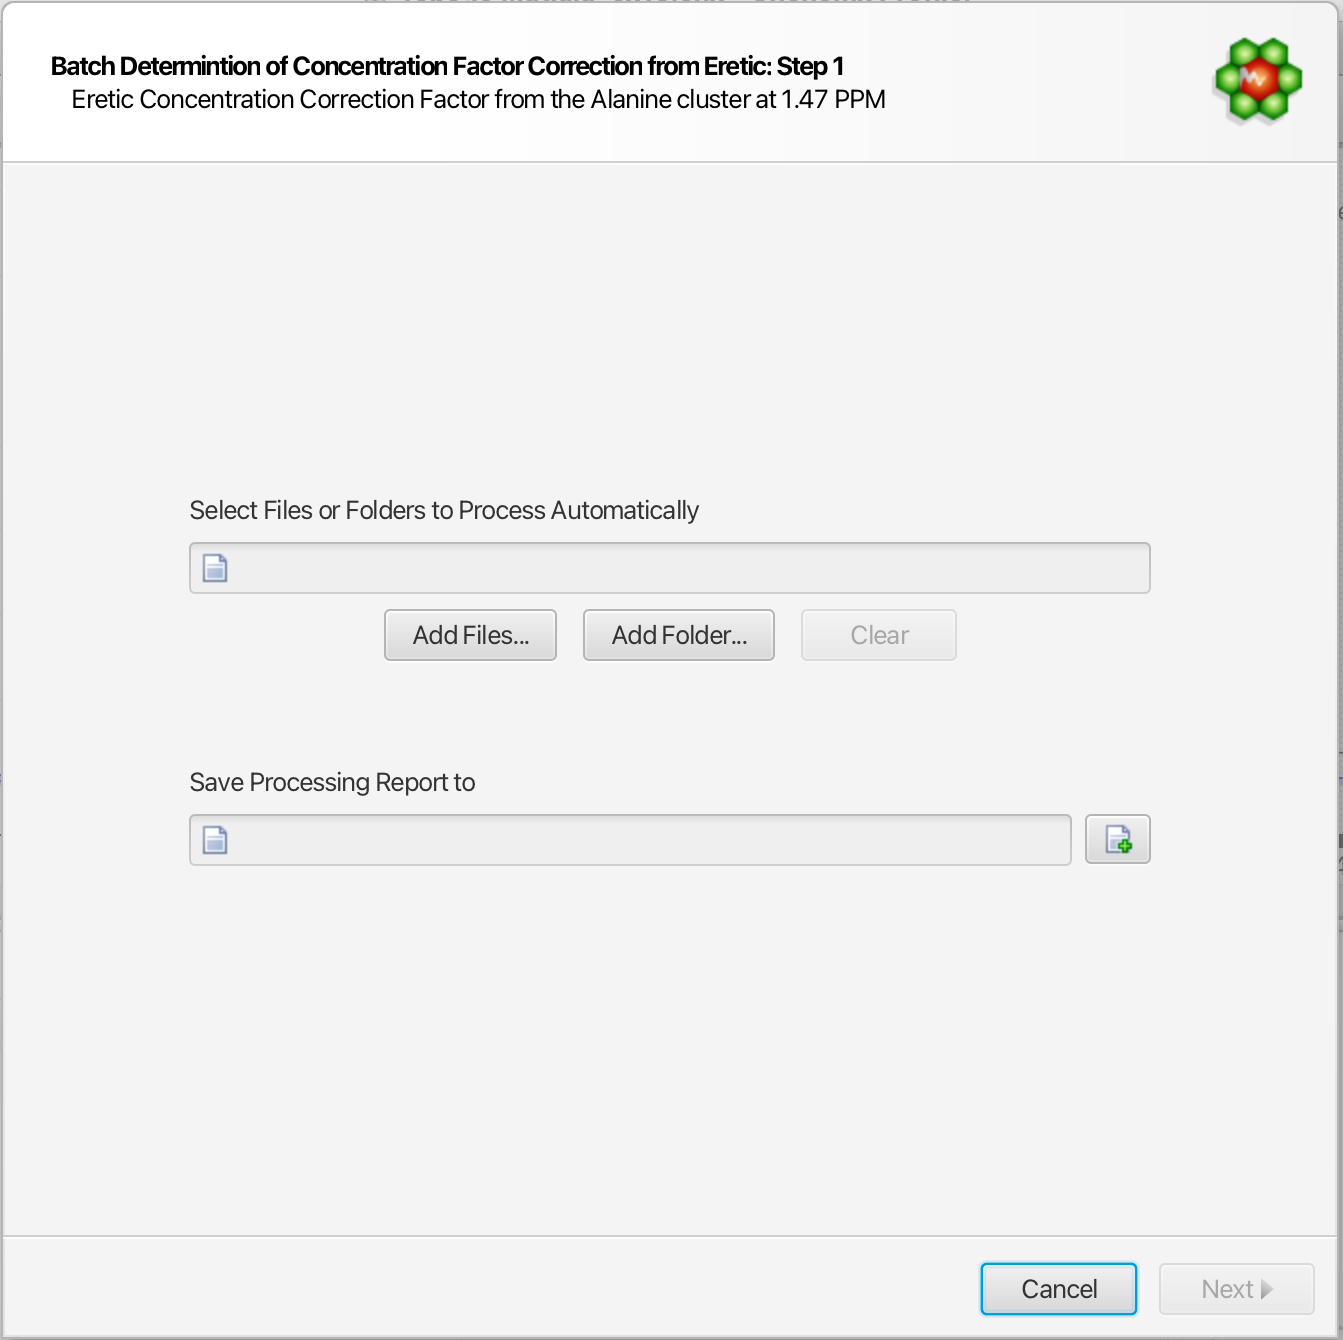
-
Enter what concentration the area of the eretic peak corresponds to.
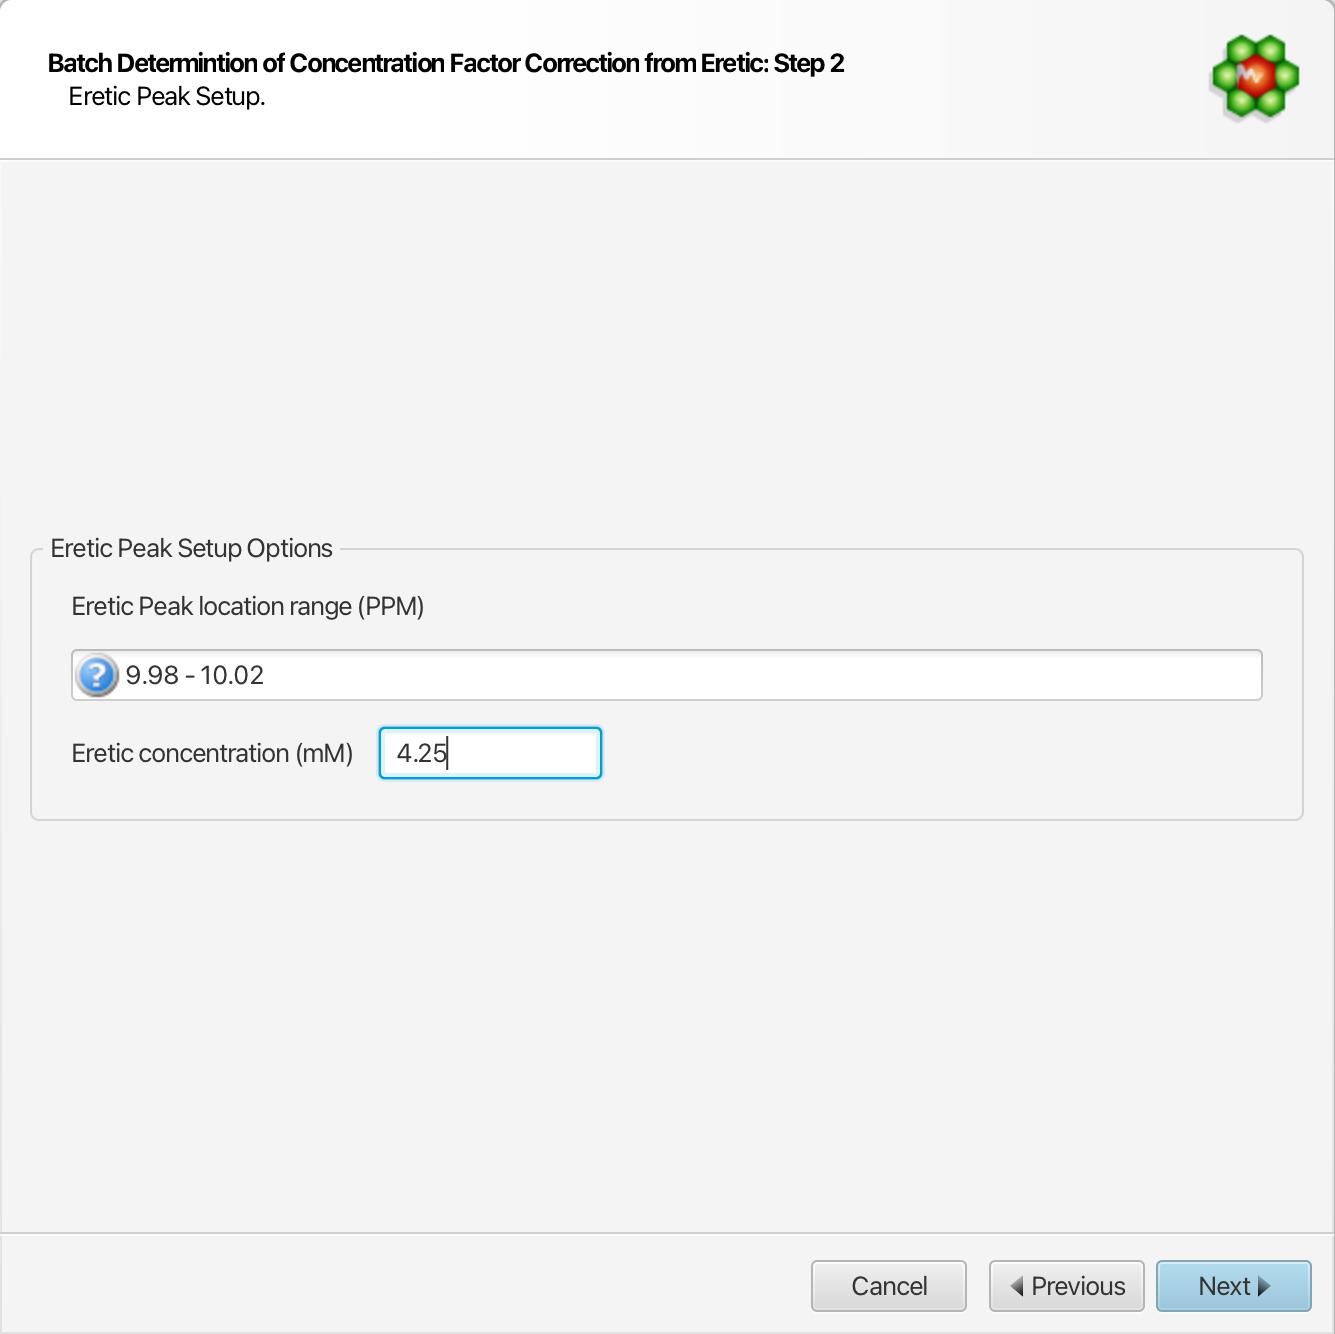
-
In a softwre like Excel, multiply all of the concentrations values exported in step 1 by the relevant correction factors output in step 3. There is a unique correction factor per file.
IMPORTANT: You must repeat these steps whenever the raw profiled concentrations are changed.